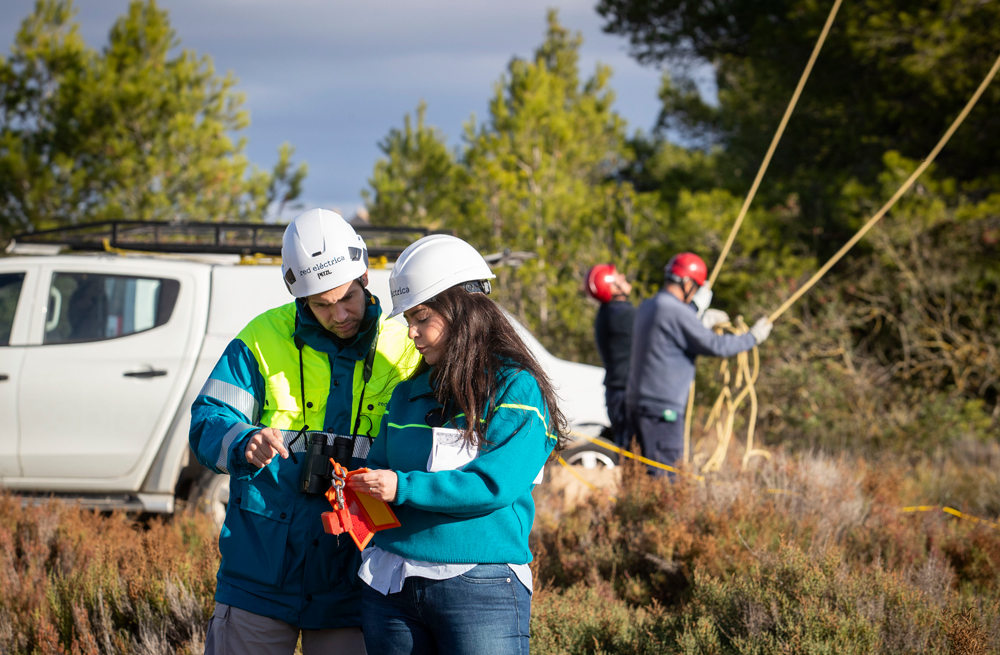
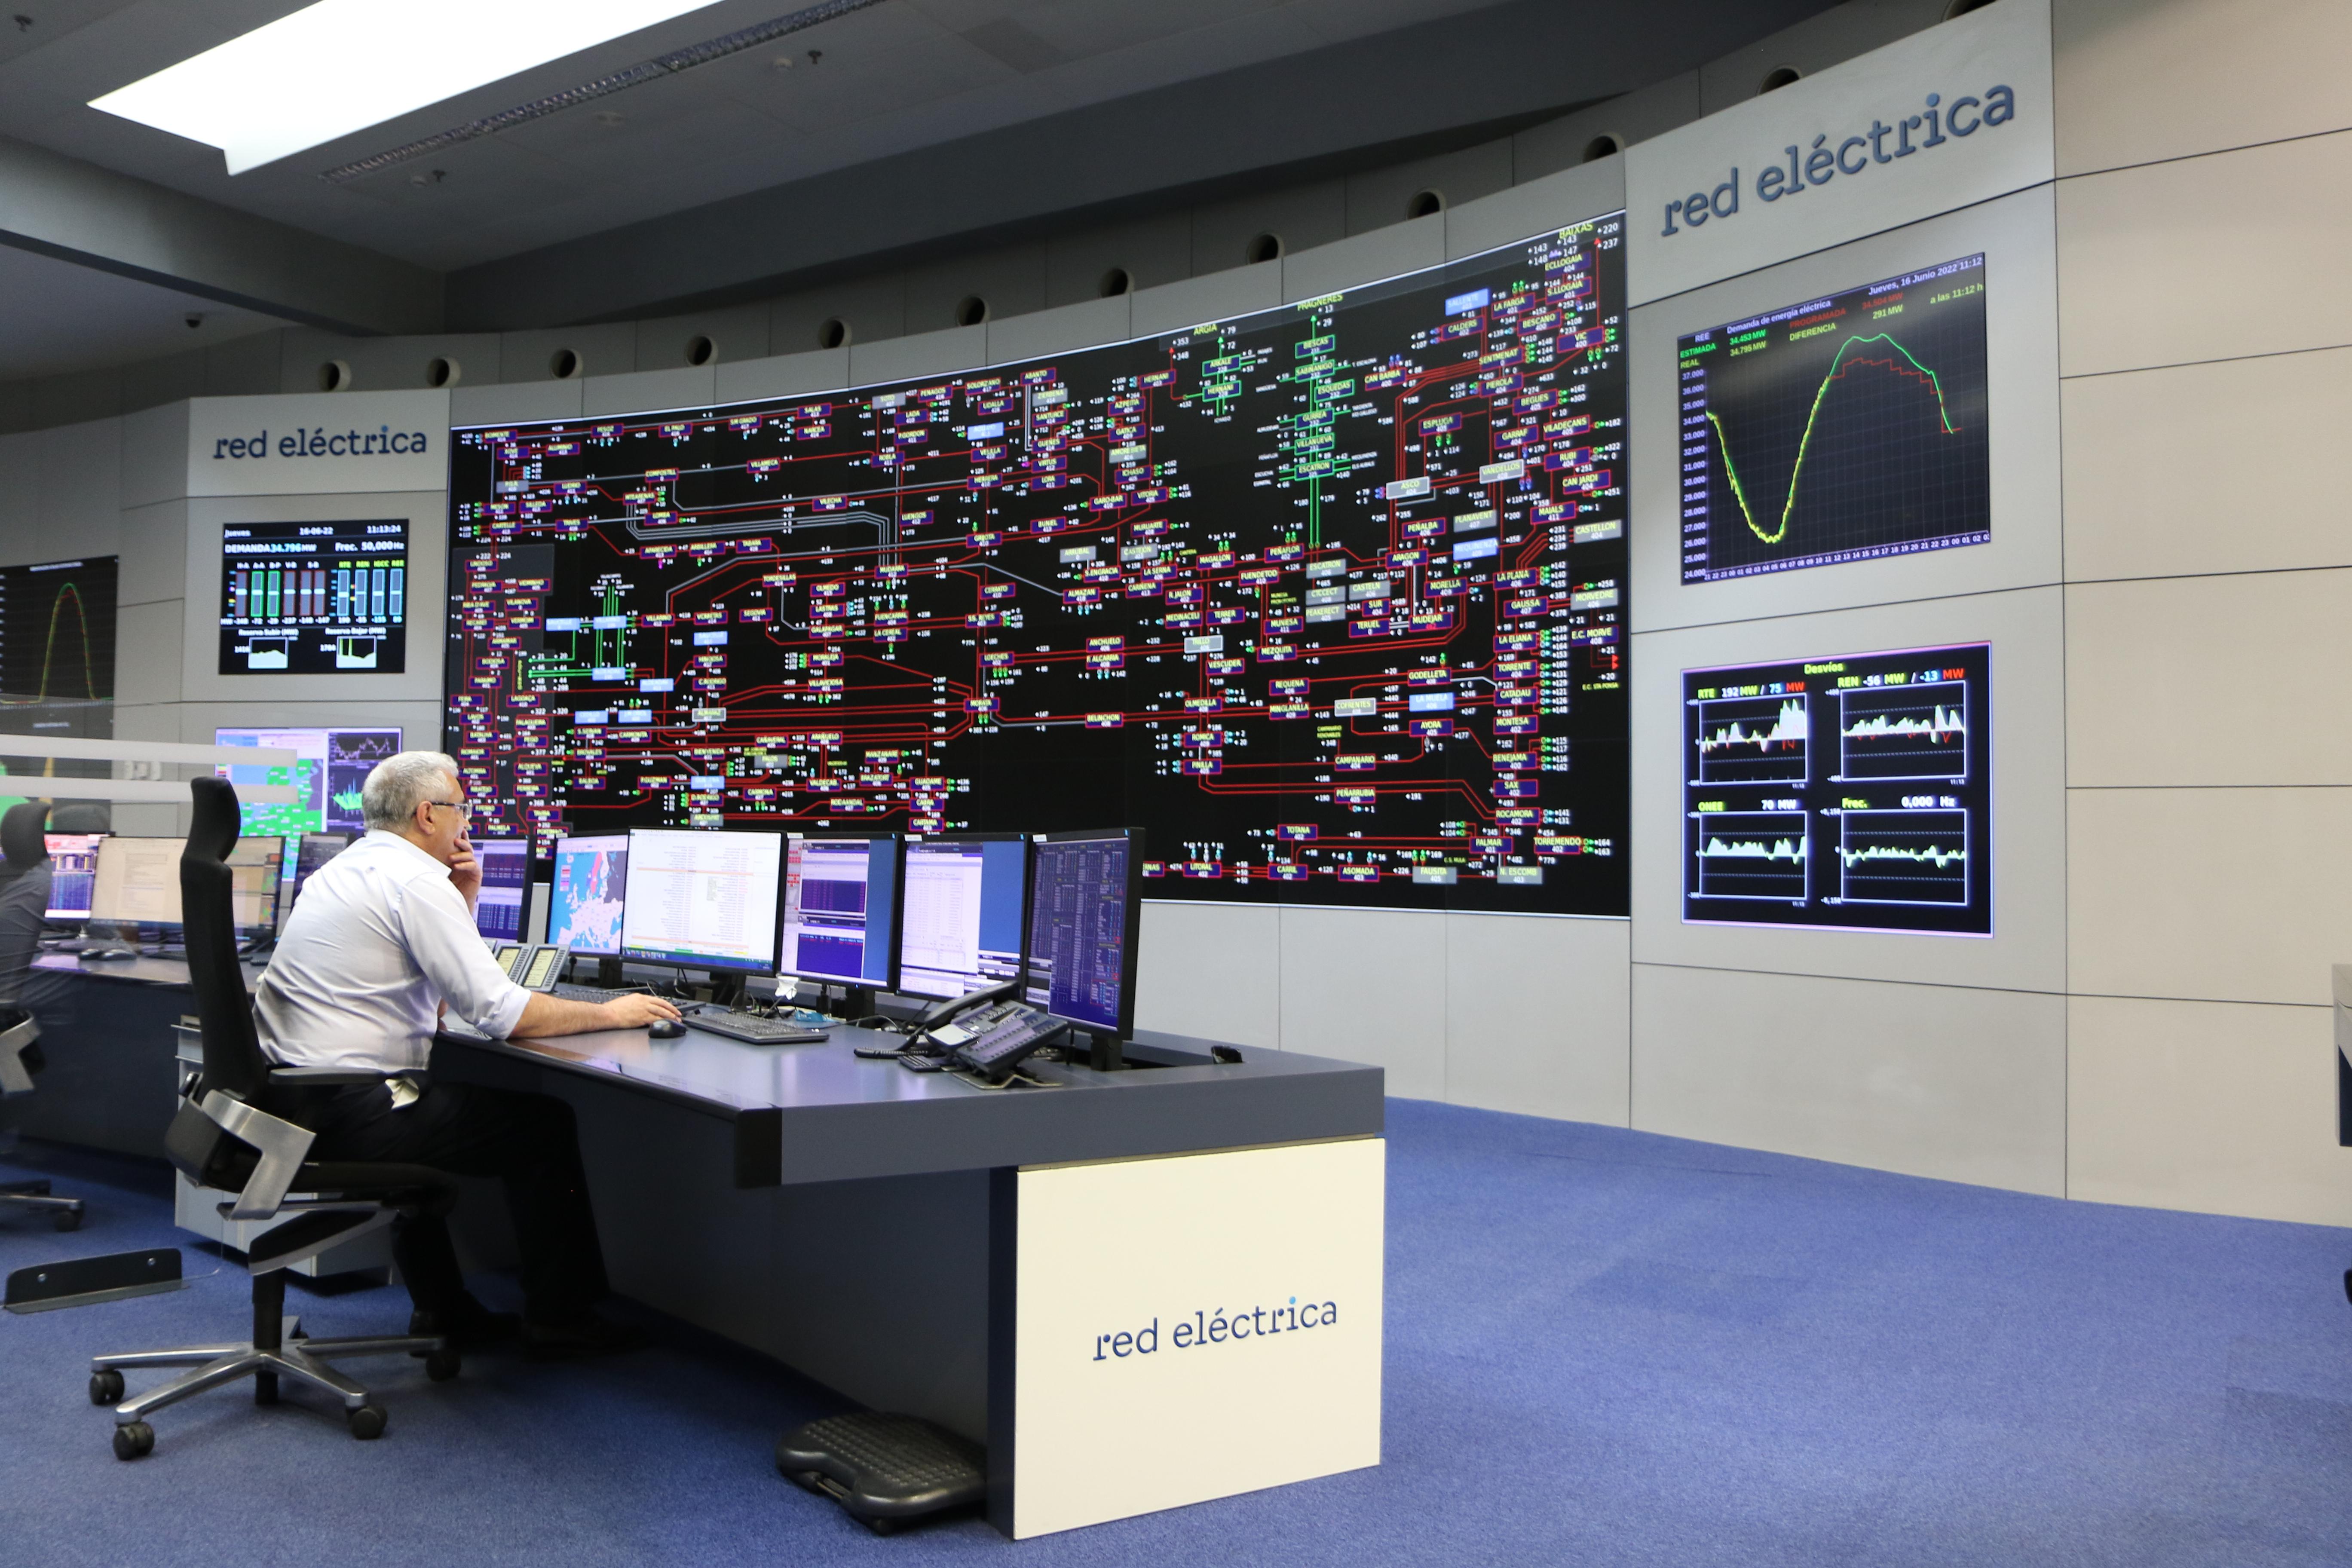
Discover what Red Eléctrica is, what we do, and why we are the backbone of the electricity system in Spain and the ecological transition.
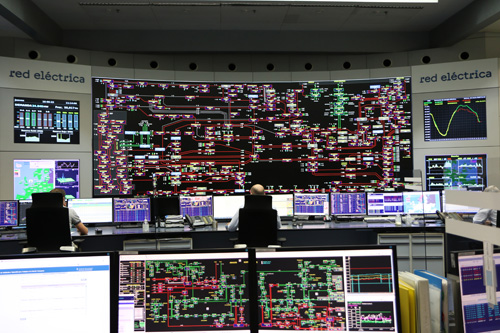


Demand and production curves in real time
Demand and production curves in real time
See the demand for each electrical system in real time.
Electricity generation and consumption at all times
We publish the energy demand being registered in the electricity system in real time. These are graphs, the so-called curves, which are updated every five minutes and include data on actual, forecast and programmed demand, as well as the maximum and minimum values of daily demand.
The curves are accompanied by the different production or generation technologies that are needed to meet the demand, including the energy destined for export and consumption of pumped storage. Also shown are the equivalent CO2 emissions associated with the Spanish generation capacity.
The curves in detail


CO2 emissions associated with electricity generation
Learn about the emission factor for each system, expressed in t CO2 eq/MWh and also the details related to emissions by time and technology. We use different sources to calculate the emission factors for each technology and system, based on the best information available.